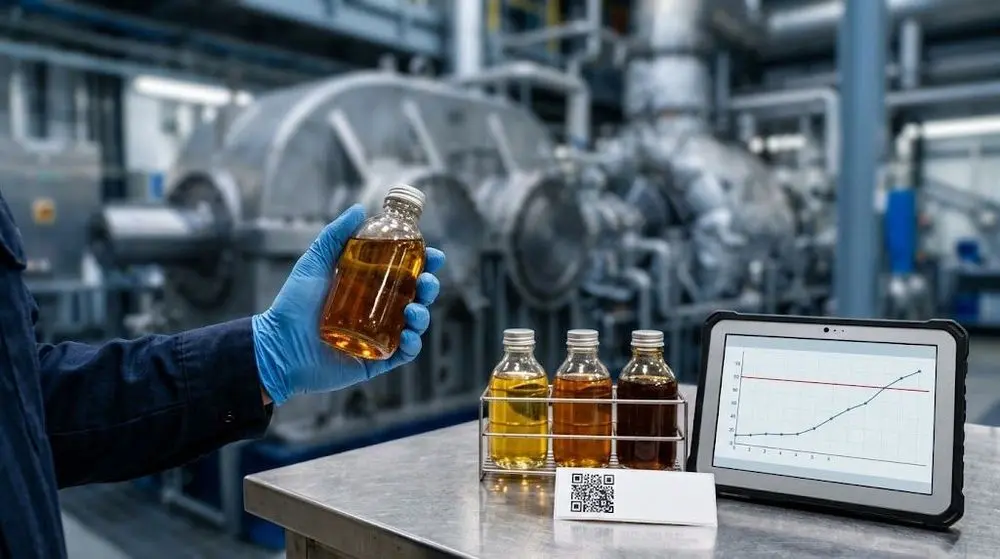
A turbine, gearbox or hydraulic system rarely fails without warning. Weeks before a bearing seizes or a servo valve sticks, the oil changes: viscosity drifts, acid builds, water creeps in, and wear metals start to climb. Oil condition monitoring is the discipline of catching those changes early enough to act, by sampling the in-service oil on a schedule, testing it, and trending the results against limits that mean something for that machine.
This guide explains what oil condition monitoring is, which tests matter, how to sample correctly, how to set alarm limits, and how to build an oil analysis program that actually prevents failures instead of producing reports nobody reads.
What is oil condition monitoring?
Oil condition monitoring (OCM) is the periodic sampling and analysis of in-service lubricant to answer three questions:
- Is the oil still fit for service? Has it oxidized, thickened, thinned, or used up its additives?
- Is it contaminated? Water, dirt, fuel, process fluid or the wrong oil all shorten machine life.
- Is the machine wearing abnormally? Rising wear particles point to the component that is failing.
A single test result tells you little. The value comes from the trend: the same tests, from the same sampling point, at regular intervals, compared with the machine's own history and with alarm limits. That is what turns oil analysis into a predictive maintenance tool: instead of replacing oil and parts on a fixed schedule, you act when the data shows a real change.
OCM sits alongside other condition monitoring techniques such as vibration analysis, thermography and ultrasound. Vibration usually detects a mechanical fault once it is already developing; oil analysis can often see the cause earlier, for example water ingress or a degraded lubricant that will lead to wear. Most reliability programs use both: condition monitoring oil analysis covers the lubricant and what it carries, while vibration covers the mechanical behaviour of the machine.
Why oil analysis for predictive maintenance pays off
- Fewer unplanned failures. Contamination and lubricant degradation are among the most common root causes of bearing and gear failures, and both are visible in the oil long before the machine stops.
- Oil changes on condition, not on the calendar. Large turbine and hydraulic reservoirs are expensive to drain. Trending oxidation stability and acid number lets you extend drain intervals safely or justify an early change with data.
- Root-cause evidence. When something does fail, the sample history shows when the problem started and what caused it.
- Audit-ready records. Power, aviation and process industries increasingly need documented, traceable lubricant data.
The tests that matter, and what each one tells you
Test slates differ by machine type, but most programs cover the same three groups. For a deeper explanation of each test, see our guide to lab and in-service lubricant tests.
Lubricant condition (is the oil still good?)
- Kinematic viscosity (ASTM D445) is the first number most programs trend. A significant change from the new-oil value usually signals oxidation, contamination with another fluid, fuel dilution, or shear of viscosity modifiers. Many programs flag a change of around 10% from the new-oil reference, but the right limit depends on the oil and the machine. An automatic kinematic viscometer makes this test fast enough to run on every sample.
- Acid number (TAN) rises as the oil oxidizes and acidic by-products accumulate.
- Remaining oxidation life, measured by the rotating pressure vessel oxidation test (RPVOT, ASTM D2272), shows how much antioxidant reserve is left. It is a key test for turbine and other long-life circulating oils; we explain the difference between new-oil stability testing and in-service monitoring in oxidation stability testing vs in-service oil condition monitoring.
- Foaming tendency (ASTM D892) matters in gearboxes, compressors and circulating systems where entrained air causes cavitation and poor lubrication.
Contamination (what got into the oil?)
- Water content by Karl Fischer titration (ASTM D6304) quantifies dissolved and emulsified water down to parts-per-million levels. Water accelerates oxidation, depletes additives and causes corrosion and bearing fatigue; see water-in-oil emulsions for why it is so damaging.
- Particle counting (reported as an ISO 4406 cleanliness code) is essential for hydraulic and turbine systems with tight clearances.
- Elemental analysis picks up dirt (silicon), coolant (sodium, potassium) and process contaminants.
Machine wear (what is wearing?)
- Wear metals (iron, copper, lead, tin, chromium, aluminum) point to the component that is wearing: gears and shafts, bushings, bearing overlays, rings or pistons.
- Ferrography and particle analysis show the size and shape of wear debris, which helps tell normal rubbing wear from cutting or fatigue wear.
Oil sampling: how to take a representative sample
Sampling errors cause more bad decisions than test errors. A sample that does not represent the oil in the machine produces a trend that means nothing. The basics:
- Sample from the same point every time, ideally a dedicated sampling valve in a live, turbulent zone: in return lines, downstream of the components you want to monitor and upstream of the filter.
- Sample with the machine running at normal operating temperature, or within minutes of shutdown, so particles and water are still suspended.
- Flush the valve and line before filling the bottle, and use clean, certified sample bottles.
- Avoid drain plugs and reservoir bottoms, which collect sediment and water and exaggerate contamination.
- Label everything: asset, sampling point, date, oil type, hours since the last oil change and top-ups. Missing context is the most common reason a result cannot be interpreted.
Sampling frequency should follow criticality. Critical turbines, compressors and large hydraulic systems are commonly sampled monthly to quarterly; less critical equipment less often. The interval should be short enough that a developing problem shows up in at least two samples before it causes a failure.
Alarm limits and trending: turning numbers into decisions
A result only becomes useful when it is compared with a limit. Good programs combine three kinds:
- Fixed limits from the OEM, the lubricant supplier or a standard, for example a minimum remaining oxidation life or a maximum water content. ASTM practices such as ASTM D4378 (in-service monitoring of mineral turbine oils) and ASTM D6224 (in-service monitoring of lubricating oil for auxiliary power plant equipment) give recommended tests, frequencies and warning levels for those machines.
- Statistical limits derived from the machine population's own data. ASTM D7720 describes how to set alarm limits statistically, so they reflect what is normal for your equipment rather than a generic table.
- Rate-of-change alarms, which catch a sudden jump even while the value is still inside the fixed limit. A wear metal that doubles between two samples deserves attention even if it is "in spec".
Two habits make trending trustworthy. First, trend per sampling point, not per oil type; two identical gearboxes can have very different normal values. Second, trust the measurement before you judge the oil. Control charting the instrument with a check standard, as described in ASTM D6299, shows whether a change came from the oil or from the test.
From result to action
An oil analysis program fails when reports pile up unread. Every alarm should map to an action:
- Water up: find the source (seals, coolers, breathers, condensation), then dry or filter the oil and resample.
- Particles up: check breathers, filters and seals; filter the oil and verify with a resample.
- Viscosity off: check for top-ups with the wrong oil, fuel or process-fluid dilution, or oxidation.
- Oxidation life low or acid number rising: plan a partial or full oil change before the antioxidant reserve runs out.
- Wear metals rising: correlate with vibration and operating data, inspect the suspect component, and shorten the sampling interval until the trend stabilizes.
Close the loop by recording what was done and resampling after the fix. Over time, that history becomes the most valuable asset in the program.
How to interpret an industrial oil analysis report
An industrial oil analysis report usually lists each test result next to the previous samples, the new-oil reference and the alarm limits, with a colour or severity flag. Read it in this order:
- Check the sample information first. Wrong asset, wrong oil type or missing hours since the last oil change make every number below it unreliable.
- Look at the trend, not the single value. Compare each result with the last three or four samples from the same point. A stable value near a limit is usually less urgent than a value that has doubled since the last sample.
- Group the results. Decide whether the change is in lubricant condition (viscosity, acid number, oxidation), contamination (water, particles, dirt) or wear (metals). Problems usually show up in more than one group at once.
- Connect the dots. Rising water together with rising acid number points to oxidation driven by moisture; rising silicon together with iron points to dirt causing abrasive wear.
- Decide the action and the next sample date. Every flagged result should end with a corrective action, a resample, or a documented decision to keep running.
Example: hydraulic oil analysis
Take a hydraulic press that has been running cleanly for a year. Its particle count has been steady around ISO 4406 17/15/12 and water below 200 ppm. The latest sample shows 20/18/15 and water above 600 ppm, while viscosity and acid number have not changed. The oil itself is still good, but contamination is getting in: a failed breather, worn rod seals or a leaking cooler are the usual suspects. The right response is to find and fix the ingress, filter or dehydrate the oil, and resample within a few weeks rather than at the normal interval. Without hydraulic oil analysis, the first warning would have been a sticking valve or a pump failure.
Mail-in lab or on-site oil analysis?
Most programs start by mailing samples to a commercial laboratory. It works, but the loop is slow: shipping often adds several days before the lab's own turnaround, so by the time a result arrives the oil has moved on. Labs also vary in method and precision, which adds noise to trends.
On-site oil analysis moves the core tests to a bench at the plant or in your own lab. Results arrive within the shift, every run becomes a point on the trend, and one instrument per method keeps results consistent from sample to sample. It suits sites with many critical assets, remote locations where shipping is slow, and labs that already run ASTM methods and want the data in one place.
That is the approach behind VeroOCM, our oil condition monitoring system. Vero bench analyzers for viscosity, oxidation stability, moisture, foam and other ASTM methods report straight into one oil analysis software platform that handles sample custody, instrument QC, alarm limits and trends per asset. If you are weighing on-site oil analysis against a mail-in program, the instruments behind it are listed on our oil and fuel analysis equipment page.
Checklist: building an oil condition monitoring program
- List assets and rank them by criticality and cost of failure.
- Define a test slate per machine type (turbine, hydraulic, gearbox, compressor, engine).
- Install proper sampling valves and write a sampling procedure.
- Set the sampling interval per asset based on criticality.
- Establish baselines: new-oil reference values and the first few in-service samples.
- Set fixed, statistical and rate-of-change alarm limits.
- Assign an owner and a response action to every alarm.
- Review trends monthly and adjust limits and intervals as data builds up.